What is Monitoring Dashboard
Introduction
When you want to keep an eye on important data or system performance, a monitoring dashboard is your go-to tool. It gives you a clear, real-time view of key information all in one place. Whether you’re managing a website, a business, or a project, dashboards help you stay informed and make smarter decisions.
In this article, I’ll explain what a monitoring dashboard is, why it matters, and how you can use it effectively. You’ll also learn about different types of dashboards and the key features that make them powerful for tracking progress and spotting issues quickly.
What is a Monitoring Dashboard?
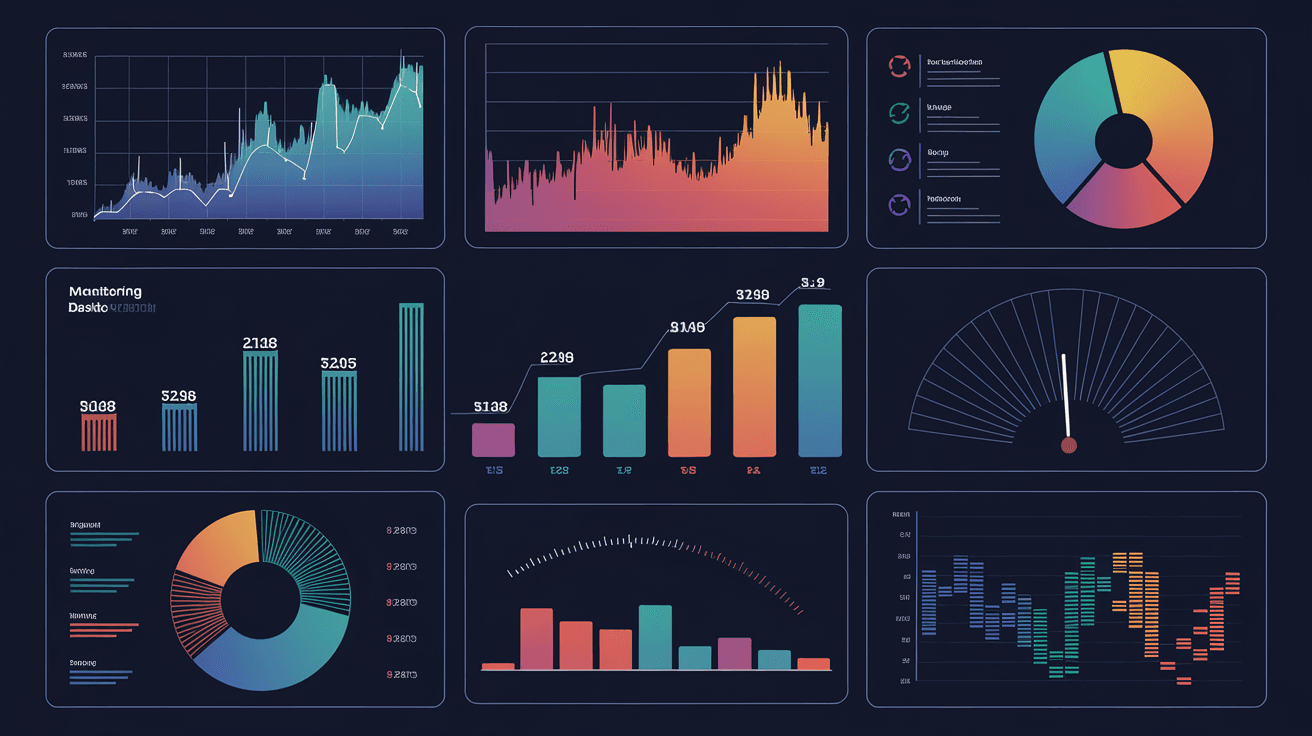
A monitoring dashboard is a visual interface that displays real-time data from various sources. It organizes this information into charts, graphs, and tables so you can easily understand complex data at a glance. The main goal is to help you track performance, spot trends, and identify problems early.
Dashboards are used in many fields like IT, business, marketing, and manufacturing. They collect data from different systems and present it in a way that’s easy to digest. For example, a website monitoring dashboard might show traffic, server status, and error rates all on one screen.
Key Characteristics of Monitoring Dashboards
- Real-time data updates: Information is refreshed continuously or at short intervals.
- Visual representation: Uses graphs, charts, and gauges for quick understanding.
- Customizable: You can choose which metrics to display based on your needs.
- Interactive: Some dashboards allow you to drill down into data for more details.
- Alerts and notifications: They can warn you when something goes wrong.
Why Are Monitoring Dashboards Important?
Monitoring dashboards play a crucial role in managing systems and processes efficiently. They help you avoid surprises by giving you early warnings about issues. This means you can fix problems before they affect customers or business outcomes.
Here’s why they matter:
- Improved decision-making: Dashboards provide clear data that supports better choices.
- Time-saving: Instead of digging through reports, you see everything in one place.
- Increased transparency: Teams can share dashboards to stay aligned on goals.
- Faster problem detection: Alerts help you react quickly to failures or drops in performance.
- Performance tracking: You can measure progress against targets easily.
Types of Monitoring Dashboards
There are several types of monitoring dashboards, each designed for specific purposes. Understanding these can help you pick the right one for your needs.
1. Operational Dashboards
These focus on real-time monitoring of daily activities. They show live data about system health, transactions, or user activity. For example, an IT team might use an operational dashboard to track server uptime and response times.
- Real-time updates every few seconds or minutes
- Alerts for immediate action
- Simple, clear visuals for quick decisions
2. Analytical Dashboards
Analytical dashboards are used for deeper data analysis. They help you explore trends, patterns, and historical data to make strategic decisions. Marketing teams often use these to analyze campaign performance over time.
- Focus on historical and trend data
- More detailed charts and filters
- Supports data exploration and insights
3. Strategic Dashboards
These dashboards provide a high-level overview of business performance. Executives use them to track key performance indicators (KPIs) aligned with company goals. They usually update less frequently but summarize important metrics.
- Focus on KPIs and long-term goals
- Summarized data from multiple sources
- Used for planning and strategy
Common Features of Monitoring Dashboards
Monitoring dashboards share several features that make them effective tools for data visualization and management.
Visual Elements
- Line and bar charts: Show trends and comparisons.
- Pie charts: Display proportions and percentages.
- Gauges: Indicate performance against targets.
- Heat maps: Highlight areas of concern or activity.
- Tables: Present detailed data in rows and columns.
Customization Options
- Choose which metrics to display
- Set thresholds for alerts
- Arrange widgets and panels
- Filter data by time, location, or category
Integration Capabilities
Dashboards connect to various data sources like databases, APIs, cloud services, and IoT devices. This integration allows them to pull in real-time information from multiple systems.
Alerts and Notifications
You can set up alerts to notify you via email, SMS, or app notifications when a metric crosses a certain threshold. This helps you respond quickly to issues.
How to Use a Monitoring Dashboard Effectively
Using a monitoring dashboard well means more than just looking at numbers. Here are some tips to get the most out of your dashboard.
Define Your Goals
Know what you want to track and why. This helps you choose the right metrics and avoid information overload.
Keep It Simple
Focus on the most important data. Too many charts or details can make the dashboard confusing.
Update Regularly
Make sure your dashboard refreshes data often enough to stay relevant. Real-time or near real-time updates are best for operational dashboards.
Customize Alerts
Set meaningful thresholds for alerts so you’re only notified about real problems.
Share with Your Team
Dashboards are great for collaboration. Share access with team members to keep everyone informed.
Examples of Monitoring Dashboards
To understand how monitoring dashboards work, here are some real-world examples:
| Industry | Dashboard Type | Key Metrics Tracked |
| IT | Operational | Server uptime, CPU usage, error rates |
| Marketing | Analytical | Website traffic, conversion rates, ROI |
| Sales | Strategic | Monthly sales, customer acquisition, targets |
| Manufacturing | Operational | Machine status, production volume, defects |
| Healthcare | Analytical | Patient wait times, treatment success rates |
These examples show how dashboards adapt to different needs but always focus on clear, actionable data.
Choosing the Right Monitoring Dashboard Tool
There are many dashboard tools available, each with unique features. When picking one, consider:
- Ease of use: Is it simple to set up and customize?
- Integration: Does it connect with your data sources?
- Real-time capabilities: How often does it update data?
- Visualization options: Are there enough chart types and customization?
- Cost: Does it fit your budget?
Popular tools include Tableau, Power BI, Grafana, and Datadog. Each suits different use cases, from business analytics to IT monitoring.
Conclusion
A monitoring dashboard is a powerful tool that helps you keep track of important data in real time. It simplifies complex information into easy-to-understand visuals, making it easier to spot problems and make informed decisions. Whether you’re managing IT systems, marketing campaigns, or business performance, dashboards keep you connected to what matters most.
By choosing the right type of dashboard and customizing it to your needs, you can save time, improve transparency, and react faster to changes. Remember to focus on clear goals, keep your dashboard simple, and share insights with your team. This way, you’ll get the most value from your monitoring dashboard.
FAQs
What is the main purpose of a monitoring dashboard?
A monitoring dashboard’s main purpose is to provide a real-time visual overview of key data. It helps users track performance, detect issues early, and make informed decisions quickly.
How often do monitoring dashboards update data?
It depends on the dashboard type. Operational dashboards update every few seconds or minutes, while strategic dashboards may refresh daily or weekly.
Can I customize which metrics appear on my dashboard?
Yes, most monitoring dashboards allow you to select and arrange the metrics you want to see. Customization helps focus on what’s important to you.
What industries use monitoring dashboards the most?
Industries like IT, marketing, sales, manufacturing, and healthcare commonly use monitoring dashboards to track performance and improve operations.
Are monitoring dashboards difficult to set up?
Many modern dashboard tools are user-friendly and offer templates. However, setup complexity depends on your data sources and customization needs.